Hi all and happy new year!
Apologies if this question has already been asked, but I didn’t find a relevant discussion here.
I’m currently working on a project involving fluid simulation and the Leap Motion sensor, running on my laptop equipped with a Nvidia GTX 1050 Ti and an Intel i7-8700. After a certain amount of particles, the framerate drops significantly. If that makes any sense, I tried to set all the nodes with the same resolution and data format, to prevent conversions, and with the preview disabled. Also, opening the performance monitor I can see that the Nvidia FlexSolver comp is taking a lot of time to cook, ~100ms per frame. That’s nothing special, though, and of course explains the low framerate.
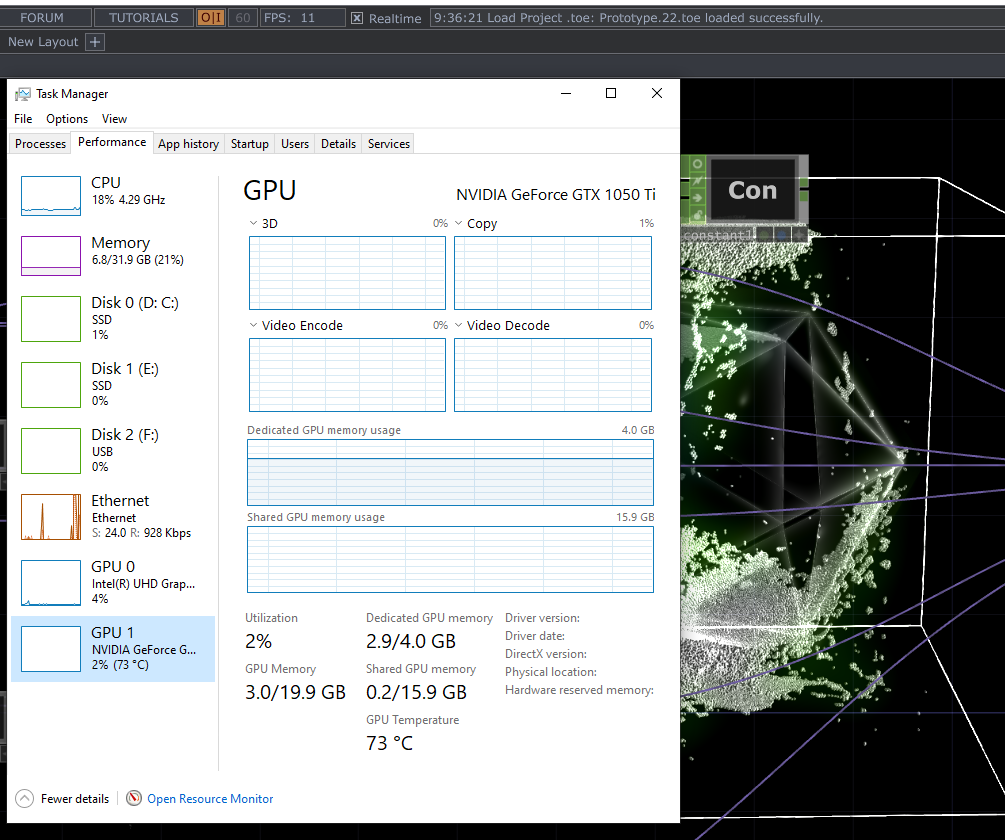
The weird thing (to me) is that when opening the Windows task manager I notice that neither the CPU nor the dedicated GPU in any of its parameters seem to be “exploited” to the extreme. What I can’t understand is how to justify that low framerate with such a minimal usage of the hardware. Am I missing any setting? Is there any bottleneck hidden to my inexperienced eye, or some technical explanation?
Just to clarify, I am running TD on a fresh Windows installation, completely debloated and optimised. Also, I made sure that TD runs on the dedicated GPU.
Any help would be much appreciated, thank you!